4FFB

A TOG:alpha/beta-tubulin Complex Structure Reveals Conformation-Based Mechanisms For a Microtubule Polymerase


Experimental Data Snapshot

  • Method: X-RAY DIFFRACTION
  • Resolution: 2.88 Å
  • R-Value Free: 
    0.267 (Depositor), 0.270 (DCC) 
  • R-Value Work: 
    0.207 (Depositor), 0.210 (DCC) 
  • R-Value Observed: 
    0.210 (Depositor) 

Starting Models: experimental
View more details

wwPDB Validation   3D Report Full Report


Ligand Structure Quality Assessment 

Created with Raphaël 2.3.0Worse 01 BetterLigand structure goodness of fit to experimental dataBest fitted GTPClick on this verticalbar to view details

This is version 1.2 of the entry. See complete history


Literature

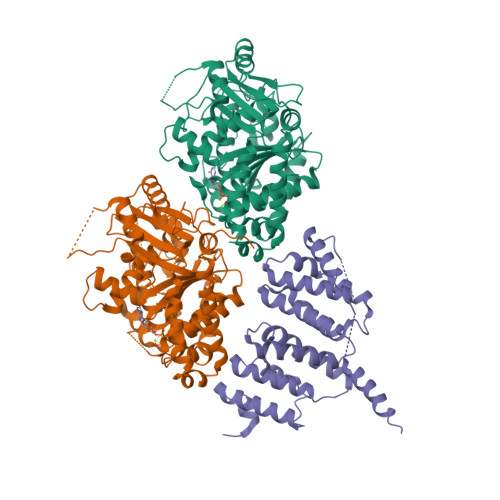
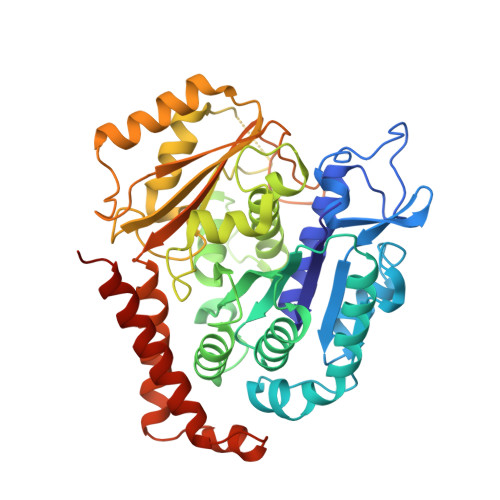
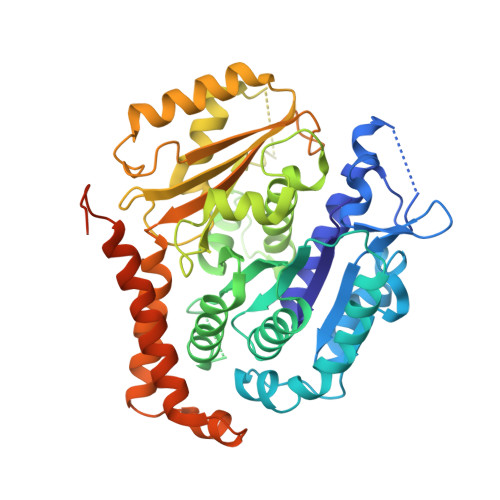
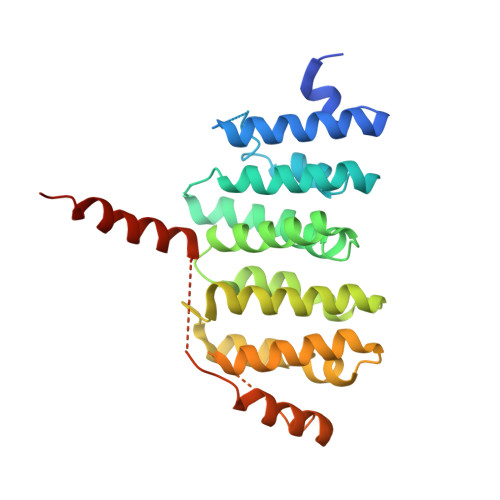
A TOG: alpha beta-tubulin complex structure reveals conformation-based mechanisms for a microtubule polymerase.

Ayaz, P.Ye, X.Huddleston, P.Brautigam, C.A.Rice, L.M.

(2012) Science 337: 857-860

  • DOI: https://doi.org/10.1126/science.1221698
  • Primary Citation of Related Structures:  
    4FFB

  • PubMed Abstract: 

    Stu2p/XMAP215/Dis1 family proteins are evolutionarily conserved regulatory factors that use αβ-tubulin-interacting tumor overexpressed gene (TOG) domains to catalyze fast microtubule growth. Catalysis requires that these polymerases discriminate between unpolymerized and polymerized forms of αβ-tubulin, but the mechanism by which they do so has remained unclear. Here, we report the structure of the TOG1 domain from Stu2p bound to yeast αβ-tubulin. TOG1 binds αβ-tubulin in a way that excludes equivalent binding of a second TOG domain. Furthermore, TOG1 preferentially binds a curved conformation of αβ-tubulin that cannot be incorporated into microtubules, contacting α- and β-tubulin surfaces that do not participate in microtubule assembly. Conformation-selective interactions with αβ-tubulin explain how TOG-containing polymerases discriminate between unpolymerized and polymerized forms of αβ-tubulin and how they selectively recognize the growing end of the microtubule.


  • Organizational Affiliation

    Department of Biophysics, University of Texas Southwestern Medical Center, 5323 Harry Hines Blvd, Dallas, TX 75390, USA.


Macromolecules
Find similar proteins by:  (by identity cutoff)  |  3D Structure
Entity ID: 1
MoleculeChains Sequence LengthOrganismDetailsImage
Tubulin alpha-1 chain447Saccharomyces cerevisiae S288CMutation(s): 0 
Gene Names: TUB1YML085C
EC: 3.6.5
UniProt
Find proteins for P09733 (Saccharomyces cerevisiae (strain ATCC 204508 / S288c))
Explore P09733 
Go to UniProtKB:  P09733
Entity Groups  
Sequence Clusters30% Identity50% Identity70% Identity90% Identity95% Identity100% Identity
UniProt GroupP09733
Sequence Annotations
Expand
  • Reference Sequence
Find similar proteins by:  (by identity cutoff)  |  3D Structure
Entity ID: 2
MoleculeChains Sequence LengthOrganismDetailsImage
Tubulin beta chain463Saccharomyces cerevisiae S288CMutation(s): 2 
Gene Names: TUB2YFL037W
EC: 3.6.5.6
UniProt
Find proteins for P02557 (Saccharomyces cerevisiae (strain ATCC 204508 / S288c))
Explore P02557 
Go to UniProtKB:  P02557
Entity Groups  
Sequence Clusters30% Identity50% Identity70% Identity90% Identity95% Identity100% Identity
UniProt GroupP02557
Sequence Annotations
Expand
  • Reference Sequence
Find similar proteins by:  (by identity cutoff)  |  3D Structure
Entity ID: 3
MoleculeChains Sequence LengthOrganismDetailsImage
Protein STU2278Saccharomyces cerevisiae S288CMutation(s): 0 
Gene Names: L2108STU2YLR045C
UniProt
Find proteins for P46675 (Saccharomyces cerevisiae (strain ATCC 204508 / S288c))
Explore P46675 
Go to UniProtKB:  P46675
Entity Groups  
Sequence Clusters30% Identity50% Identity70% Identity90% Identity95% Identity100% Identity
UniProt GroupP46675
Sequence Annotations
Expand
  • Reference Sequence
Experimental Data & Validation

Experimental Data

  • Method: X-RAY DIFFRACTION
  • Resolution: 2.88 Å
  • R-Value Free:  0.267 (Depositor), 0.270 (DCC) 
  • R-Value Work:  0.207 (Depositor), 0.210 (DCC) 
  • R-Value Observed: 0.210 (Depositor) 
Space Group: P 1 21 1
Unit Cell:
Length ( Å )Angle ( ˚ )
a = 89.12α = 90
b = 98.04β = 100.31
c = 91.366γ = 90
Software Package:
Software NamePurpose
SBC-Collectdata collection
PHENIXmodel building
PHENIXrefinement
HKL-3000data reduction
HKL-3000data scaling
PHENIXphasing

Structure Validation

View Full Validation Report


Ligand Structure Quality Assessment 

Created with Raphaël 2.3.0Worse 01 BetterLigand structure goodness of fit to experimental dataBest fitted GTPClick on this verticalbar to view details

Entry History 

Deposition Data

Revision History  (Full details and data files)

  • Version 1.0: 2012-08-15
    Type: Initial release
  • Version 1.1: 2013-08-28
    Changes: Database references
  • Version 1.2: 2023-09-13
    Changes: Data collection, Database references, Derived calculations, Refinement description