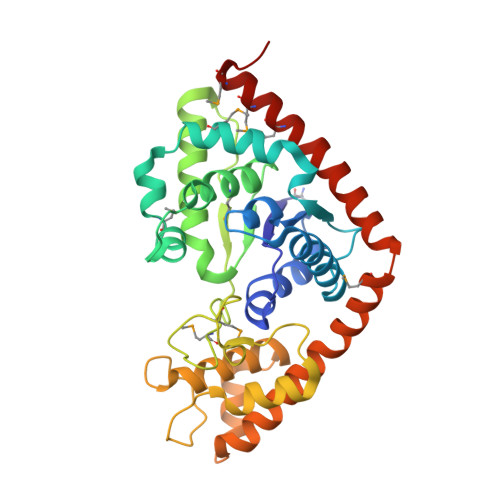
1I6L

1.7 HIGH RESOLUTION EXPERIMENTAL PHASES FOR TRYPTOPHANYL-TRNA SYNTHETASE COMPLEXED WITH TRYPTOPHANYL-5'AMP


Experimental Data Snapshot

  • Method: X-RAY DIFFRACTION
  • Resolution: 1.72 Å
  • R-Value Free: 0.241 
  • R-Value Work: 0.209 

wwPDB Validation   3D Report Full Report


Ligand Structure Quality Assessment 


This is version 1.4 of the entry. See complete history


Literature

High-resolution experimental phases for tryptophanyl-tRNA synthetase (TrpRS) complexed with tryptophanyl-5'AMP.

Retailleau, P.Yin, Y.Hu, M.Roach, J.Bricogne, G.Vonrhein, C.Roversi, P.Blanc, E.Sweet, R.M.Carter, C.W.

(2001) Acta Crystallogr D Biol Crystallogr 57: 1595-1608

  • DOI: https://doi.org/10.1107/s090744490101215x
  • Primary Citation of Related Structures:  
    1I6K, 1I6L, 1I6M

  • PubMed Abstract: 

    Native data, anomalous data at three wavelengths and an independent peak-wavelength data set for SeMet-substituted protein have been collected from cryoprotected crystals of the TrpRS-adenylate product (TAM) complex to a resolution limit of 1.7 A. Independent phase sets were developed using SHARP and improved by solvent flipping with SOLOMON using molecular envelopes derived from experimental densities for, respectively, peak-wavelength SAD data from four different crystals, MAD data and their M(S)IRAS combinations with native data. Hendrickson-Lattman phase-probability coefficients from each phase set were used in BUSTER to drive maximum-likelihood refinements of well defined parts of the previously refined room-temperature 2.9 A structure. Maximum-entropy completion followed by manual rebuilding was then used to generate a model for the missing segments, bound ligand and solvent molecules. Surprisingly, peak-wavelength SAD experiments produced the smallest phase errors relative to the refined structures. Selenomethionylated models deviate from one another by 0.25 A and from the native model by 0.38 A, but all have r.m.s. deviations of approximately 1.0 A from the 2.9 A model. Difference Fourier calculations between amplitudes from the 300 K experiment and the new amplitudes at 100 K using 1.7 A model phases show no significant structural changes arising from temperature variation or addition of cryoprotectant. The main differences between low- and high-resolution structures arise from correcting side-chain rotamers in the core of the protein as well as on the surface. These changes improve various structure-validation criteria.


  • Organizational Affiliation

    Department of Biochemistry and Biophysics, CB# 7260, University of North Carolina at Chapel Hill, Chapel Hill, NC, USA.


Macromolecules
Find similar proteins by:  (by identity cutoff)  |  3D Structure
Entity ID: 1
MoleculeChains Sequence LengthOrganismDetailsImage
TRYPTOPHANYL-TRNA SYNTHETASE328Geobacillus stearothermophilusMutation(s): 10 
EC: 6.1.1.2
UniProt
Find proteins for P00953 (Geobacillus stearothermophilus)
Explore P00953 
Go to UniProtKB:  P00953
Entity Groups  
Sequence Clusters30% Identity50% Identity70% Identity90% Identity95% Identity100% Identity
UniProt GroupP00953
Sequence Annotations
Expand
  • Reference Sequence
Small Molecules
Ligands 4 Unique
IDChains Name / Formula / InChI Key2D Diagram3D Interactions
TYM
Query on TYM

Download Ideal Coordinates CCD File 
J [auth A]TRYPTOPHANYL-5'AMP
C21 H24 N7 O8 P
IFQVDHDRFCKAAW-SQIXAUHQSA-N
SO4
Query on SO4

Download Ideal Coordinates CCD File 
B [auth A]
C [auth A]
D [auth A]
E [auth A]
F [auth A]
B [auth A],
C [auth A],
D [auth A],
E [auth A],
F [auth A],
G [auth A],
H [auth A]
SULFATE ION
O4 S
QAOWNCQODCNURD-UHFFFAOYSA-L
GOL
Query on GOL

Download Ideal Coordinates CCD File 
K [auth A]
L [auth A]
M [auth A]
N [auth A]
O [auth A]
K [auth A],
L [auth A],
M [auth A],
N [auth A],
O [auth A],
P [auth A]
GLYCEROL
C3 H8 O3
PEDCQBHIVMGVHV-UHFFFAOYSA-N
NH4
Query on NH4

Download Ideal Coordinates CCD File 
I [auth A]AMMONIUM ION
H4 N
QGZKDVFQNNGYKY-UHFFFAOYSA-O
Modified Residues  1 Unique
IDChains TypeFormula2D DiagramParent
MSE
Query on MSE
A
L-PEPTIDE LINKINGC5 H11 N O2 SeMET
Experimental Data & Validation

Experimental Data

  • Method: X-RAY DIFFRACTION
  • Resolution: 1.72 Å
  • R-Value Free: 0.241 
  • R-Value Work: 0.209 
  • Space Group: P 43 21 2
Unit Cell:
Length ( Å )Angle ( ˚ )
a = 59.77α = 90
b = 59.77β = 90
c = 232.65γ = 90
Software Package:
Software NamePurpose
BUSTER-TNTrefinement
BUSTERrefinement
SHARPphasing
DENZOdata reduction
SCALEPACKdata scaling
BUSTERphasing

Structure Validation

View Full Validation Report


Ligand Structure Quality Assessment 


Entry History 

Deposition Data

Revision History  (Full details and data files)

  • Version 1.0: 2001-11-07
    Type: Initial release
  • Version 1.1: 2008-04-27
    Changes: Version format compliance
  • Version 1.2: 2011-07-13
    Changes: Derived calculations, Version format compliance
  • Version 1.3: 2019-07-24
    Changes: Data collection, Derived calculations, Refinement description
  • Version 1.4: 2024-11-20
    Changes: Data collection, Database references, Derived calculations, Structure summary