7MRZ

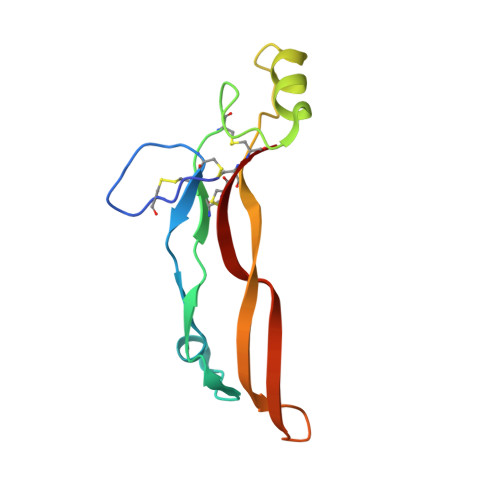
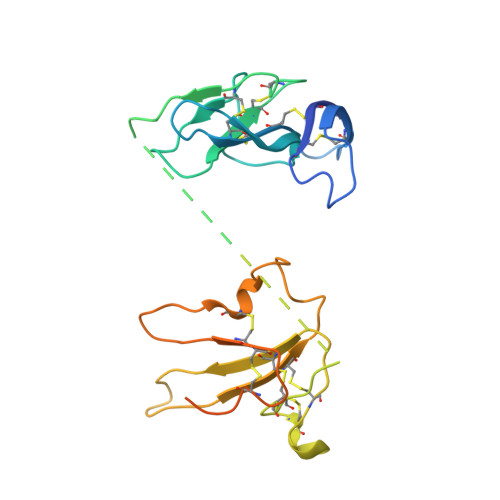
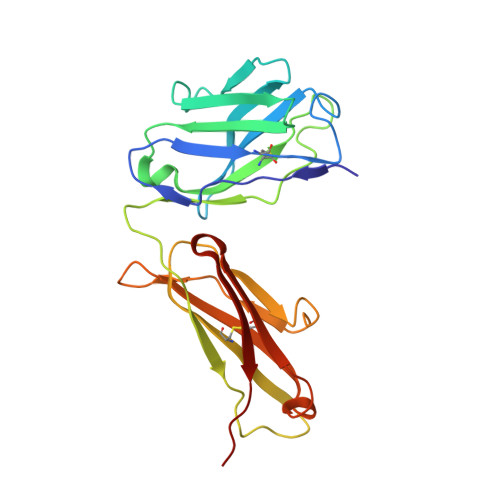
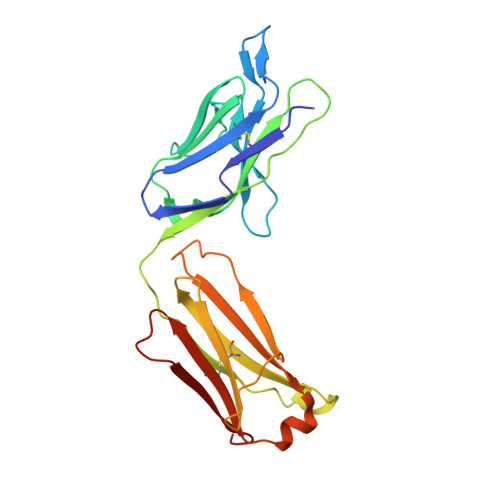
Structure of GDF11 bound to fused ActRIIB-ECD and Alk4-ECD with Anti-ActRIIB Fab fragment


Experimental Data Snapshot

  • Method: X-RAY DIFFRACTION
  • Resolution: 3.00 Å
  • R-Value Free: 0.327 
  • R-Value Work: 0.288 
  • R-Value Observed: 0.290 

Starting Model: experimental
View more details

wwPDB Validation   3D Report Full Report


Ligand Structure Quality Assessment 


This is version 1.2 of the entry. See complete history


Literature

Structures of activin ligand traps using natural sets of type I and type II TGF beta receptors.

Goebel, E.J.Kattamuri, C.Gipson, G.R.Krishnan, L.Chavez, M.Czepnik, M.Maguire, M.C.Grenha, R.Hakansson, M.Logan, D.T.Grinberg, A.V.Sako, D.Castonguay, R.Kumar, R.Thompson, T.B.

(2022) iScience 25: 103590-103590

  • DOI: https://doi.org/10.1016/j.isci.2021.103590
  • Primary Citation of Related Structures:  
    7MRZ, 7OLY

  • PubMed Abstract: 

    The 30+ unique ligands of the TGFβ family signal by forming complexes using different combinations of type I and type II receptors. Therapeutically, the extracellular domain of a single receptor fused to an Fc molecule can effectively neutralize subsets of ligands. Increased ligand specificity can be accomplished by using the extracellular domains of both the type I and type II receptor to mimic the naturally occurring signaling complex. Here, we report the structure of one "type II-type I-Fc" fusion, ActRIIB-Alk4-Fc, in complex with two TGFβ family ligands, ActA, and GDF11, providing a snapshot of this therapeutic platform. The study reveals that extensive contacts are formed by both receptors, replicating the ternary signaling complex, despite the inherent low affinity of Alk4. Our study shows that low-affinity type I interactions support altered ligand specificity and can be visualized at the molecular level using this platform.


  • Organizational Affiliation

    Department of Molecular Genetics, Biochemistry, and Microbiology, University of Cincinnati, 231 Albert Sabin Way ML 0524, Cincinnati, OH 45267, USA.


Macromolecules
Find similar proteins by:  (by identity cutoff)  |  3D Structure
Entity ID: 1
MoleculeChains Sequence LengthOrganismDetailsImage
Growth/differentiation factor 11109Homo sapiensMutation(s): 0 
Gene Names: GDF11BMP11
UniProt & NIH Common Fund Data Resources
Find proteins for O95390 (Homo sapiens)
Explore O95390 
Go to UniProtKB:  O95390
PHAROS:  O95390
GTEx:  ENSG00000135414 
Entity Groups  
Sequence Clusters30% Identity50% Identity70% Identity90% Identity95% Identity100% Identity
UniProt GroupO95390
Sequence Annotations
Expand
  • Reference Sequence
Find similar proteins by:  (by identity cutoff)  |  3D Structure
Entity ID: 2
MoleculeChains Sequence LengthOrganismDetailsImage
Activin receptor type-2B,Activin receptor type-1BB [auth C]254Homo sapiensMutation(s): 0 
Gene Names: ACVR2BACVR1BACVRLK4ALK4
EC: 2.7.11.30
UniProt & NIH Common Fund Data Resources
Find proteins for P36896 (Homo sapiens)
Explore P36896 
Go to UniProtKB:  P36896
PHAROS:  P36896
GTEx:  ENSG00000135503 
Find proteins for Q13705 (Homo sapiens)
Explore Q13705 
Go to UniProtKB:  Q13705
PHAROS:  Q13705
GTEx:  ENSG00000114739 
Entity Groups  
Sequence Clusters30% Identity50% Identity70% Identity90% Identity95% Identity100% Identity
UniProt GroupsP36896Q13705
Glycosylation
Glycosylation Sites: 1Go to GlyGen: Q13705-1P36896-1
Sequence Annotations
Expand
  • Reference Sequence
Find similar proteins by:  (by identity cutoff)  |  3D Structure
Entity ID: 3
MoleculeChains Sequence LengthOrganismDetailsImage
Fab Heavy ChainC [auth X]222Homo sapiensMutation(s): 0 
Entity Groups  
Sequence Clusters30% Identity50% Identity70% Identity90% Identity95% Identity100% Identity
Sequence Annotations
Expand
  • Reference Sequence
Find similar proteins by:  (by identity cutoff)  |  3D Structure
Entity ID: 4
MoleculeChains Sequence LengthOrganismDetailsImage
Fab Light ChainD [auth Y]221Homo sapiensMutation(s): 0 
Entity Groups  
Sequence Clusters30% Identity50% Identity70% Identity90% Identity95% Identity100% Identity
Sequence Annotations
Expand
  • Reference Sequence
Experimental Data & Validation

Experimental Data

  • Method: X-RAY DIFFRACTION
  • Resolution: 3.00 Å
  • R-Value Free: 0.327 
  • R-Value Work: 0.288 
  • R-Value Observed: 0.290 
  • Space Group: P 61 2 2
Unit Cell:
Length ( Å )Angle ( ˚ )
a = 68.261α = 90
b = 68.261β = 90
c = 990.38γ = 120
Software Package:
Software NamePurpose
PHENIXrefinement
XDSdata reduction
Aimlessdata scaling
PHASERphasing
PDB_EXTRACTdata extraction

Structure Validation

View Full Validation Report


Ligand Structure Quality Assessment 


Entry History & Funding Information

Deposition Data


Funding OrganizationLocationGrant Number
National Institutes of Health/National Institute of General Medical Sciences (NIH/NIGMS)United States5R35GM134923-02

Revision History  (Full details and data files)

  • Version 1.0: 2022-01-19
    Type: Initial release
  • Version 1.1: 2023-10-18
    Changes: Data collection, Refinement description
  • Version 1.2: 2024-10-30
    Changes: Structure summary