


New Features
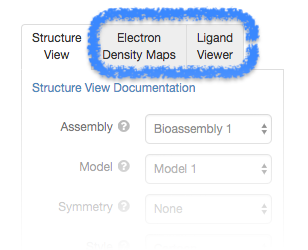
View Interactions and Maps in 3D
02/27
RCSB PDB's 3D Viewer has new options for viewing crystal structure electron density maps and for visualizing ligand-macromolecule interactions. All features are described in the 3D View User Guide.
3D View: Ligand Viewer
Features include options to display the binding pocket surface and non-covalent interactions (Hydrophobic Contacts, Hydrogen Bonds, Halogen Bonds, Metal Interactions, Pi Interactions).
Calculations are performed in real-time within the web browser using the NGL Viewer, our web-based tool for molecular graphics and structure analysis.
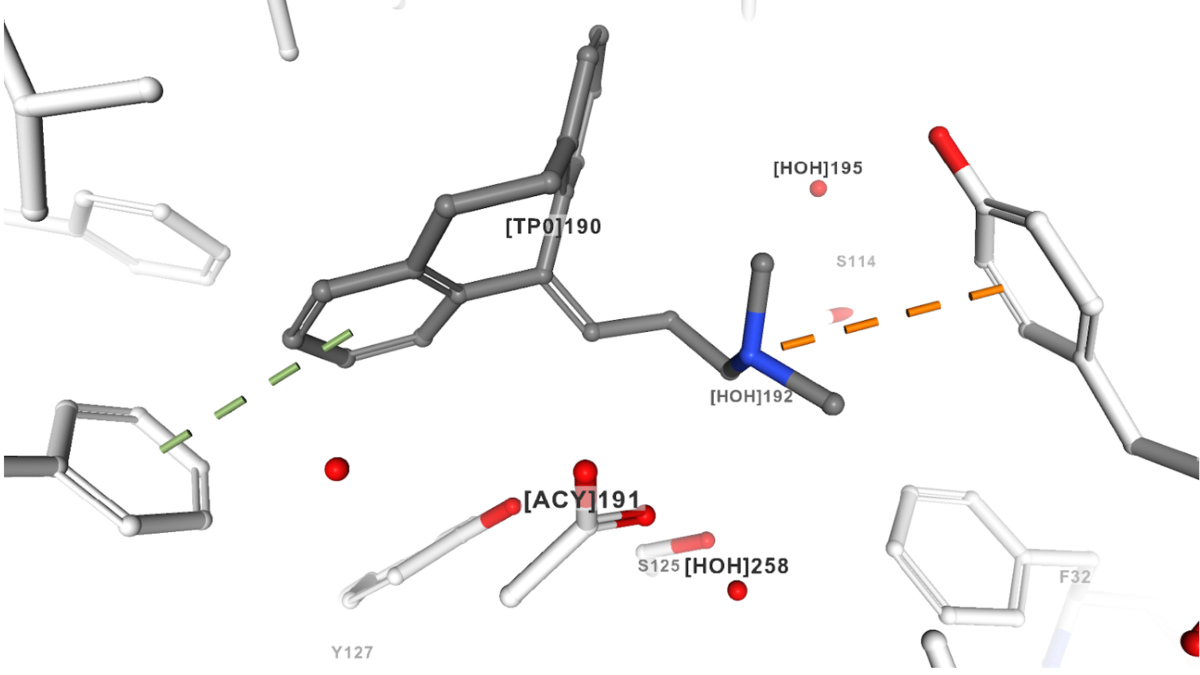 Pi stacking (green dashed line) and Cation-pi interaction (orange dashed line) of amitriptyline (ligand ID TP0) as seen in the A variant of human alfa1-acid glycoprotein (PDB structure 3APV).
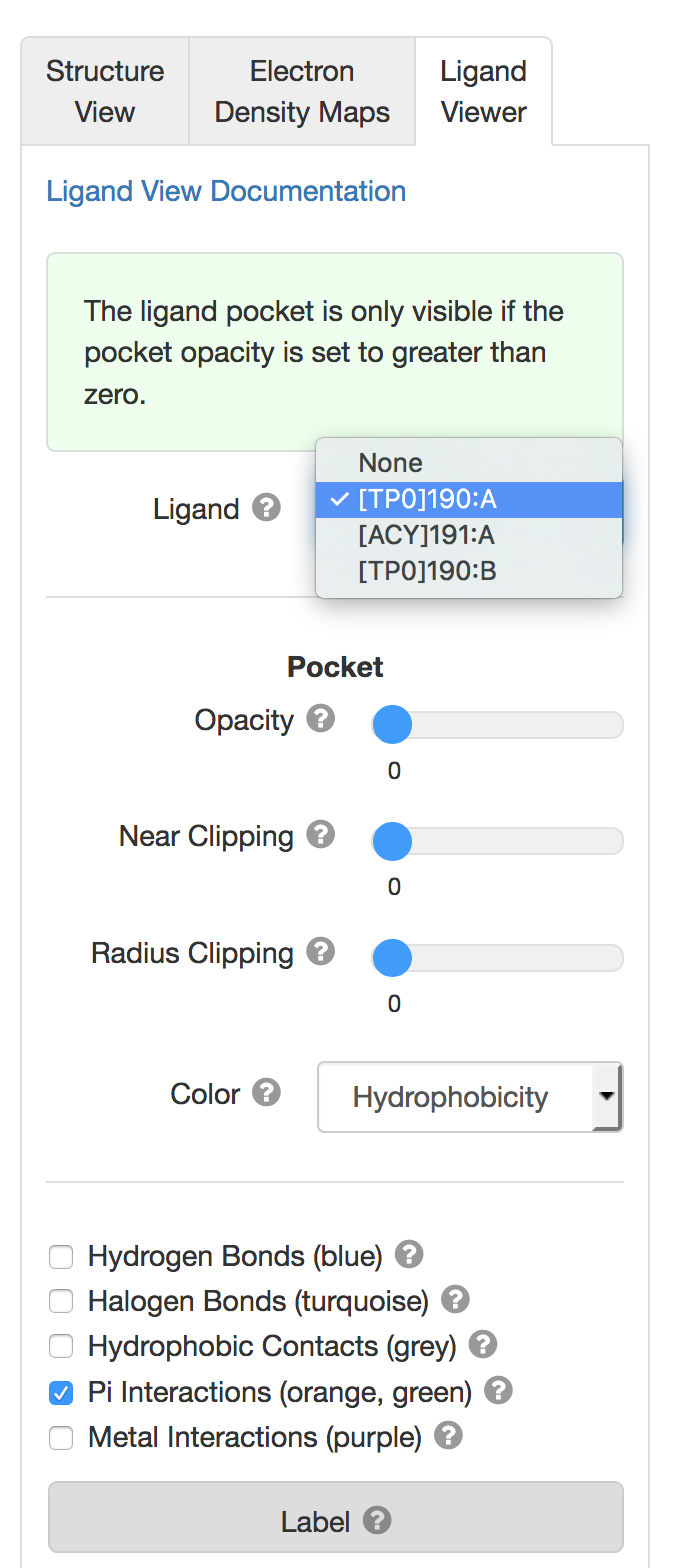 Users can toggle among ligands using the pulldown menu.
3D View: Electron Density Maps
NGL now displays 2fo-fc (blue mesh/surface) and fo-fc (red/green mesh/surface) maps in the context of the structural model for X-ray crystallographic structures. Electron density maps combine the structural model (coordinates) and the experimentally-collected data from an X-ray structure determination and serve to represent the fit of the model to the data. Even in the best quality structures, there are areas of poor electron density, which may represent sections of the model that exist in multiple conformations. For more information, see the User Guide or learn more about Structure Factors and Electron Density at PDB-101.
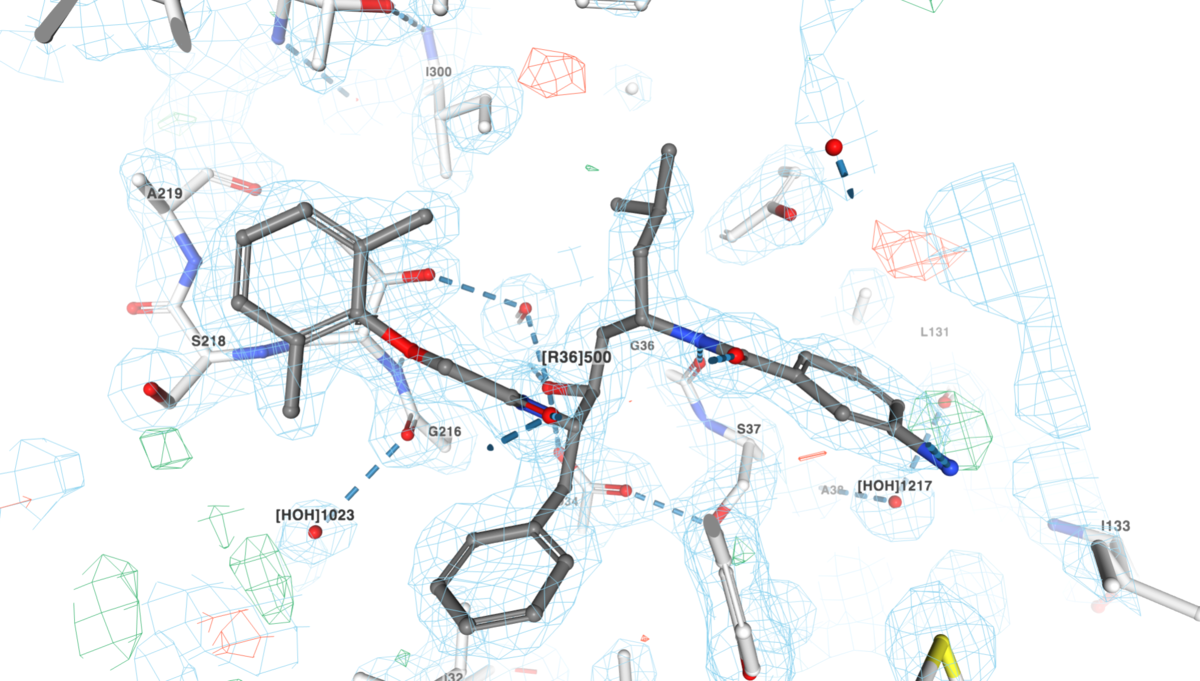 Close up view of the electron density around the inhibitor (ligand ID R36) seen in complex with plasmepsin (PDB structure 1LEE; zoom in to get same view).
 Users can select one or both maps to display, change the style of presentation, and change the size of the map displayed.
