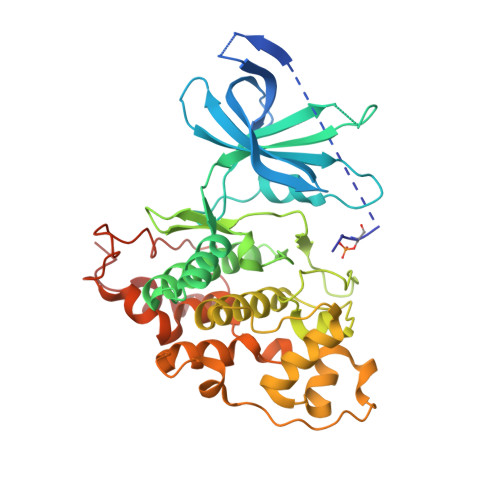
4NM3

Crystal structure of GSK-3/Axin complex bound to phosphorylated N-terminal auto-inhibitory pS9 peptide


Experimental Data Snapshot

  • Method: X-RAY DIFFRACTION
  • Resolution: 2.10 Å
  • R-Value Free: 0.242 
  • R-Value Work: 0.194 
  • R-Value Observed: 0.197 

Starting Model: experimental
View more details

wwPDB Validation   3D Report Full Report


Ligand Structure Quality Assessment 


This is version 1.3 of the entry. See complete history


Literature

Structural basis of GSK-3 inhibition by N-terminal phosphorylation and by the Wnt receptor LRP6.

Stamos, J.L.Chu, M.L.Enos, M.D.Shah, N.Weis, W.I.

(2014) Elife 3: e01998-e01998

  • DOI: https://doi.org/10.7554/eLife.01998
  • Primary Citation of Related Structures:  
    4NM0, 4NM3, 4NM5, 4NM7, 4NU1

  • PubMed Abstract: 

    Glycogen synthase kinase-3 (GSK-3) is a key regulator of many cellular signaling pathways. Unlike most kinases, GSK-3 is controlled by inhibition rather than by specific activation. In the insulin and several other signaling pathways, phosphorylation of a serine present in a conserved sequence near the amino terminus of GSK-3 generates an auto-inhibitory peptide. In contrast, Wnt/β-catenin signal transduction requires phosphorylation of Ser/Pro rich sequences present in the Wnt co-receptors LRP5/6, and these motifs inhibit GSK-3 activity. We present crystal structures of GSK-3 bound to its phosphorylated N-terminus and to two of the phosphorylated LRP6 motifs. A conserved loop unique to GSK-3 undergoes a dramatic conformational change that clamps the bound pseudo-substrate peptides, and reveals the mechanism of primed substrate recognition. The structures rationalize target sequence preferences and suggest avenues for the design of inhibitors selective for a subset of pathways regulated by GSK-3. DOI: http://dx.doi.org/10.7554/eLife.01998.001.


  • Organizational Affiliation

    Department of Structural Biology, Stanford University, Stanford, United States.


Macromolecules
Find similar proteins by:  (by identity cutoff)  |  3D Structure
Entity ID: 1
MoleculeChains Sequence LengthOrganismDetailsImage
Glycogen synthase kinase-3 beta389Homo sapiensMutation(s): 0 
Gene Names: GSK3B
EC: 2.7.11.26 (PDB Primary Data), 2.7.11.1 (PDB Primary Data)
UniProt & NIH Common Fund Data Resources
Find proteins for P49841 (Homo sapiens)
Explore P49841 
Go to UniProtKB:  P49841
PHAROS:  P49841
GTEx:  ENSG00000082701 
Entity Groups  
Sequence Clusters30% Identity50% Identity70% Identity90% Identity95% Identity100% Identity
UniProt GroupP49841
Sequence Annotations
Expand
  • Reference Sequence

Find similar proteins by:  Sequence   |   3D Structure  

Entity ID: 2
MoleculeChains Sequence LengthOrganismDetailsImage
Axin-124Homo sapiensMutation(s): 0 
Gene Names: AXINAXIN1
UniProt & NIH Common Fund Data Resources
Find proteins for O15169 (Homo sapiens)
Explore O15169 
Go to UniProtKB:  O15169
PHAROS:  O15169
GTEx:  ENSG00000103126 
Entity Groups  
Sequence Clusters30% Identity50% Identity70% Identity90% Identity95% Identity100% Identity
UniProt GroupO15169
Sequence Annotations
Expand
  • Reference Sequence
Small Molecules
Ligands 5 Unique
IDChains Name / Formula / InChI Key2D Diagram3D Interactions
ADP
Query on ADP

Download Ideal Coordinates CCD File 
K [auth A]ADENOSINE-5'-DIPHOSPHATE
C10 H15 N5 O10 P2
XTWYTFMLZFPYCI-KQYNXXCUSA-N
DTT
Query on DTT

Download Ideal Coordinates CCD File 
J [auth A]2,3-DIHYDROXY-1,4-DITHIOBUTANE
C4 H10 O2 S2
VHJLVAABSRFDPM-IMJSIDKUSA-N
GOL
Query on GOL

Download Ideal Coordinates CCD File 
C [auth A],
D [auth A],
E [auth A],
F [auth A]
GLYCEROL
C3 H8 O3
PEDCQBHIVMGVHV-UHFFFAOYSA-N
CL
Query on CL

Download Ideal Coordinates CCD File 
I [auth A]CHLORIDE ION
Cl
VEXZGXHMUGYJMC-UHFFFAOYSA-M
MG
Query on MG

Download Ideal Coordinates CCD File 
G [auth A],
H [auth A]
MAGNESIUM ION
Mg
JLVVSXFLKOJNIY-UHFFFAOYSA-N
Modified Residues  1 Unique
IDChains TypeFormula2D DiagramParent
SEP
Query on SEP
A
L-PEPTIDE LINKINGC3 H8 N O6 PSER
Binding Affinity Annotations 
IDSourceBinding Affinity
CL BindingDB:  4NM3 IC50: 6530 (nM) from 1 assay(s)
EC50: 3.00e+6 (nM) from 1 assay(s)
Experimental Data & Validation

Experimental Data

  • Method: X-RAY DIFFRACTION
  • Resolution: 2.10 Å
  • R-Value Free: 0.242 
  • R-Value Work: 0.194 
  • R-Value Observed: 0.197 
  • Space Group: P 61 2 2
Unit Cell:
Length ( Å )Angle ( ˚ )
a = 81.032α = 90
b = 81.032β = 90
c = 281.085γ = 120
Software Package:
Software NamePurpose
Aimlessdata scaling
PHENIXrefinement
PDB_EXTRACTdata extraction
Blu-Icedata collection
XDSdata reduction
PHENIXphasing

Structure Validation

View Full Validation Report


Ligand Structure Quality Assessment 


Entry History 

Deposition Data

Revision History  (Full details and data files)

  • Version 1.0: 2014-03-26
    Type: Initial release
  • Version 1.1: 2014-04-23
    Changes: Database references
  • Version 1.2: 2023-09-20
    Changes: Data collection, Database references, Derived calculations, Refinement description
  • Version 1.3: 2024-11-20
    Changes: Structure summary